1
Derivatives Rollover Report |February 26, 202
1
For Private Circulation Only
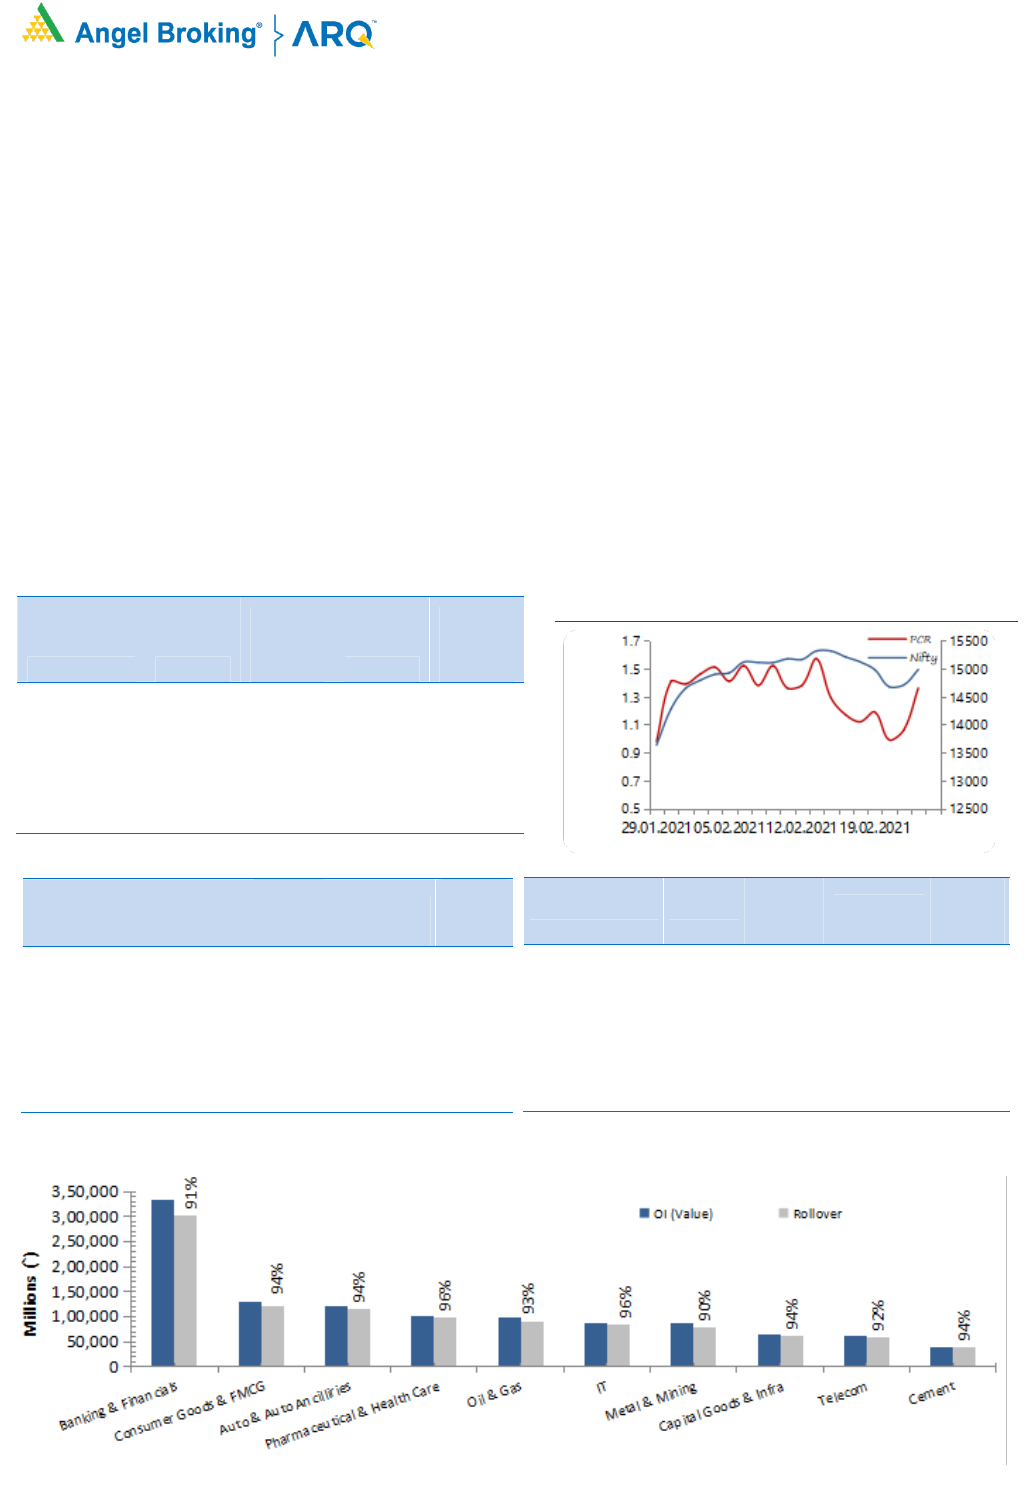
NIFTY & PCR Graph
Monthly Gainers
Scrip Price
Price
Change
(%)
Open
Interest
Ol
Change
(%)
ADANIENT 849.55
65.31
17882000
(1.92)
HINDALCO 350.75
52.27
23912300
(2.51)
TATACHEM 738.10
50.42
8748000
9.13
MOTHERSUMI 219.20
46.82
30926000
5.34
SBIN 409.60
44.76
82491000
9.27
Note: Stocks which have more than 1000 contract in Futures OI.
Monthly Losers
Scrip Price
Price
Change
(%)
Open
Interest
Ol
Change
(%)
GODREJCP
700.95
(9.93)
4681000
81.57
EICHERMOT
2564.15
(8.74)
2731400
25.12
AUROPHARMA
867.05
(8.56)
9348950
24.91
MARUTI
6980.40
(8.46)
3127900
34.02
MCDOWELL-N
548.20
(7.92)
14170000
26.14
Note: Stocks which have more than 1000 contract in Futures OI.
We started the February series amidst a corrective phase and post registering a low around 13600 on the first
day of the series, the index resumed the upmove and rallied to register new high above 15400 in the midst of
the series. We then saw some correction towards 14600 but no meaningful shorts were seen in that decline and
hence, it just seemed like a regular profit booking. The index managed to recover to end the February series
around the 15100 mark.
In the initial couple of weeks of the series, we witnessed long formations in Nifty as well as Bank Nifty and no
meaningful shorts were seen during corrections. The long positions got rolled to the March series as the
rollovers are bit higher than its 3-month average. FII’s too rolled over their bullish positions and their ‘Long
Short Ratio’ at the start of series stands at 76 percent.
The global markets have witnessed higher volatility which could lead to long unwind
ing in our markets too.
Traders are advised to lighten up longs and stay light on positions till the volatility settles down. It would be
prudent to see how things pan out at the start of the series and hence, one should keep a close tab on the data
changes in next few sessions. The immediate support for Nifty is placed around 14500 followed by 14200.
.
Indices Change
INDEX Price
Price
Change
(%) Rollover
3
month
avg.
NIFTY
15097.35 9.57
78.25 77.16
BANKNIFTY
36549.00 20.93
77.76 76.81
-
- -
- -
-
- - - -
-
- - - -
Derivatives Rollover Report
For Private Circulation Only
2
Scrip Price
Price
Change
(%) OI Futures
OI
Change
(%) COC (%) PCR-OI
Rollover
(%)
Average
Rollover
(3month)
(%)
AUTO & AUTO ANCILLARIES
AMARAJABAT
891.10
(6.03)
2906000
75.59
1.10
0.64
96.45
93.40
APOLLOTYRE
242.10
18.88
14395000
(11.25)
4.05
0.57
93.02
92.81
ASHOKLEY
132.05
16.65
37989000
23.10
8.95
0.53
88.83
91.27
BAJAJ-AUTO
3964.70
(4.54)
1581500
(17.50)
6.61
0.70
87.46
91.88
BALKRISIND
1587.35
(4.65)
2484400
113.29
5.69
0.67
95.89
88.89
BHARATFORG
623.75
6.56
6630000
44.78
6.09
0.42
95.77
95.26
BOSCHLTD
15169.05
(3.87)
98650
25.67
5.28
0.62
97.82
95.55
EICHERMOT
2564.15
(8.74)
2731400
25.12
6.23
0.56
94.30
94.66
ESCORTS
1315.10
7.23
2786300
(20.71)
6.02
0.49
95.64
96.36
EXIDEIND 208.80
5.88
12481200
(5.14) 5.33
0.57
96.28
94.22
HEROMOTOCO
3413.80
3.02
3440700
5.45
-7.84
0.77
97.99
96.23
M&M
864.90
12.47
8433600
(16.76)
8.95
0.41
84.08
88.94
MARUTI
6980.40
(8.46)
3127900
34.02
9.42
0.49
95.31
95.18
MOTHERSUMI
219.20
46.82
30926000
5.34
5.67
0.36
93.66
93.00
MRF
88088.85
0.21
52500
(0.74)
6.90
0.67
98.41
93.72
TATAMOTORS
335.50
25.21
80124900
13.35
9.20
0.62
93.81
93.42
TVSMOTOR
600.05
13.45
4131400
(11.30)
8.64
0.54
90.77
93.68
BANKING & FINANCIALS
AXISBANK
774.15
15.13
36848400
(21.24)
5.92
0.62
85.09
90.29
BAJAJFINSV
10326.70
14.97
545125
(11.20)
7.91
0.32
93.87
90.95
BAJFINANCE
5565.90
15.41
3783750
(5.62)
8.47
0.79
92.68
87.69
BANKBARODA
86.70
29.31
87995700
16.44
-47.10
0.50
88.53
89.17
CANBK
164.35
27.90
53600400
(8.08)
6.78
0.47
96.90
92.09
CHOLAFIN
525.65
29.49
5110000
15.94
-0.99
0.31
88.56
89.65
FEDERALBNK
86.90
20.86
82170000
(2.02)
9.82
0.45
96.68
96.23
HDFC
2697.80
10.66
15518700
(16.05)
6.36
0.43
86.61
90.65
HDFCBANK
1611.90
17.36
21406550
(26.13)
4.46
0.77
95.80
94.92
IBULHSGFIN
227.30
17.04
34310800
33.30
10.70
0.49
96.51
96.09
ICICIBANK
632.40
19.41
107536000
16.41
9.13
0.42
96.60
95.34
ICICIPRULI
480.90
(2.24)
6993000
58.09
8.87
0.52
96.52
96.06
INDUSINDBK
1117.30
38.43
22734900
35.92
8.87
0.62
93.51
94.05
KOTAKBANK
1906.80
10.38
12695200
(19.53)
7.77
0.60
94.16
91.35
L&TFH
106.80
24.77
35910176
60.25
6.75
0.45
78.82
85.47
LICHSGFIN
454.55
14.63
9866000
34.67
9.53
0.41
94.27
93.38
M&MFIN
216.05
31.50
13508000
(12.01)
-17.85
0.31
90.95
94.19
MANAPPURAM
180.45
17.37
18654000
20.64
8.73
0.33
96.85
94.33
Derivatives Rollover Report
For Private Circulation Only
3
Scrip Price
Price
Change
(%) OI Futures
OI
Change
(%) COC (%) PCR-OI
Rollover
(%)
Average
Rollover
(3month)
(%)
MFSL
893.20
31.97
3023800
(42.96)
6.08
0.17
88.74
93.95
MUTHOOTFIN
1330.70
18.63
2847750
(42.18)
1.52
0.56
76.78
89.04
PFC
130.15
17.57
35513600
34.27
4.02
0.50
82.39
85.82
PNB
42.10
28.55
157472000
(5.88)
6.22
0.57
81.91
72.75
RBLBANK 250.55
17.99
17823400
(32.96) 8.38
0.39
64.57
84.79
RECLTD
143.60
5.63
17640000
70.63
0.45
0.40
82.10
86.07
SBIN
409.60
44.76
82491000
9.27
7.52
0.71
93.32
90.72
SRTRANSFIN
1389.75
24.30
3856000
15.17
8.92
0.53
86.41
90.45
CAPITAL GOODS & INFRASTRUCTURE
ADANIPORTS
708.50
35.74
53875000
60.45
7.77
0.47
93.17
82.91
BHEL
47.50
29.60
124467000
19.57
9.68
0.52
95.32
95.96
GMRINFRA
27.00
9.09
147712500
4.31
7.28
0.37
98.48
98.33
HAVELLS
1180.10
(0.30)
3232000
(34.16)
4.77
0.23
94.89
91.51
LT
1517.15
12.39
12321100
(4.84)
9.26
0.58
94.86
94.95
SIEMENS
1920.60
16.79
733700
2.22
7.47
0.18
93.94
79.15
VOLTAS
1054.35
12.54
2557000
32.42
7.02
0.22
92.68
91.49
CEMENT
ACC
1811.70
10.63
2745500
10.95
7.56
0.39
92.47
95.26
AMBUJACEM
280.10
12.40
14124000
(25.42)
1.86
0.35
79.77
91.25
GRASIM
1276.85
19.07
16153800
(9.50)
6.10
0.53
97.88
98.35
RAMCOCEM
991.95
26.04
1689800
17.98
10.80
0.00
93.60
95.39
SHREECEM
27610.50
19.11
119500
(22.70)
7.57
0.14
85.63
89.85
ULTRACEMCO
6436.00
17.71
1493000
9.49
10.70
0.40
97.63
95.87
CHEMICAL & FERTILIZERS
PIDILITIND
CHEMICALS & FERTILIZERS
PIDILITIND
1730.35
0.28
2286000
(23.02)
8.34
0.73
98.15
94.62
TATACHEM
738.10
50.42
8748000
9.13
9.79
0.55
89.36
91.47
UPL
595.80
4.79
18226000
21.02
6.27
0.47
97.55
96.08
Consumer Goods & FMCG
ASIANPAINT
2390.65
(2.58)
6532500
23.71
9.28
0.46
96.73
87.25
BERGEPAINT
728.15
(0.95)
3201000
15.29
9.47
0.64
97.00
94.74
BRITANNIA
3413.80
(5.44)
2537600
37.88
3.35
0.69
93.65
96.60
COLPAL
1576.30
0.48
3030300
10.41
4.44
1.00
98.75
96.19
CONCOR
556.00
(5.86)
7139784
40.51
7.43
0.32
99.05
94.03
Derivatives Rollover Report
For Private Circulation Only
4
Scrip Price
Price
Change
(%) OI Futures
OI
Change
(%) COC (%) PCR-OI
Rollover
(%)
Average
Rollover
(3month)
(%)
DABUR
511.00
(3.56)
9855000
(29.08)
4.99
0.66
93.03
95.90
GODREJCP
700.95
(9.93)
4681000
81.57
8.52
0.60
97.28
92.61
HINDUNILVR
2177.85
(5.77)
8536200
45.75
8.77
0.78
94.77
95.46
ITC
210.45
1.57
135692800
32.04
8.10
0.49
93.57
94.16
JUBLFOOD
3073.65
13.18
1373500
6.31
7.40
0.59
91.28
92.68
MARICO 409.40
(1.08)
5946000
(27.03) -1.27
0.53
70.80
87.97
MCDOWELL-N
548.20
(7.92)
14170000
26.14
9.10
0.71
96.39
96.96
NESTLEIND
16222.05
(6.88)
370650
21.05
8.75
0.77
96.42
97.33
TATACONSUM
633.20
11.73
13221900
(10.77)
9.75
0.33
95.51
96.29
TITAN
1444.65
(0.81)
6573750
8.18
9.22
0.82
91.16
94.01
UBL
1202.80
(4.65)
1183700
(21.64)
4.57
1.00
93.84
86.60
METALS & MINING
COALINDIA
152.50
18.54
41164200
22.60
-30.06
0.46
82.75
82.67
HINDALCO
350.75
52.27
23912300
(2.51)
0.19
0.82
76.74
87.29
JINDALSTEL
347.25
27.52
22580000
(3.32)
8.88
0.32
95.66
95.95
JSWSTEEL
424.40
12.48
29907900
(12.75)
8.19
0.37
92.96
95.45
NATIONALUM
57.35
23.33
63104000
11.84
2.28
0.44
86.65
87.01
NMDC
128.30
19.52
49834600
23.55
3.06
0.52
82.73
86.38
SAIL
73.70
28.73
98097000
125.07
8.90
0.79
91.64
76.09
TATASTEEL
747.55
19.19
40198200
3.05
8.16
0.55
90.30
93.73
VEDL
209.85
28.51
96075200
23.79
10.65
1.11
95.83
96.05
Media
PVR
1420.50
(1.62)
1684166
(7.37)
6.46
1.09
93.79
92.44
SUNTV
513.30
3.83
11155500
15.77
3.44
0.38
94.29
91.39
ZEEL
210.15
(5.00)
34632000
44.82
9.69
0.83
95.86
95.73
INFORMATION TECHNOLOGY
HCLTECH
932.55
(0.67)
18306400
(3.21)
4.63
0.71
97.15
96.75
INFY
1283.35
0.27
32199600
(1.80)
9.00
0.60
96.91
96.64
MINDTREE
1613.30
(3.63)
1144800
(36.20)
7.31
1.10
96.30
92.84
COFORGE 2524.05
4.28
317250 (50.06) 3.70
0.31
96.47 93.65
TCS
3006.55
(6.39)
7101000
42.86
4.92
0.80
95.45
94.40
TECHM
963.75
(2.10)
10609200
(22.32)
8.10
0.72
93.38
94.04
WIPRO
422.00
(1.97)
29689600
0.43
2.17
0.62
96.17
93.92
Derivatives Rollover Report
For Private Circulation Only
5
Scrip Price
Price
Change
(%) OI Futures
OI
Change
(%) COC (%) PCR-OI
Rollover
(%)
Average
Rollover
(3month)
(%)
INFORMATION TECHNOLOGY
HCLTECH 564.00
(0.70)
22885800
(1.26)
8.14
0.58
98.56
96.78
INFY 730.55
3.77
24351600
(52.50)
2.86
0.74
55.98
79.52
MINDTREE 782.95
10.93
1041600
(14.29)
-15.63
0.59
93.13
93.37
NIITTECH 1606.65
6.68
578250
26.08
-2.03
0.46
89.76
82.99
TCS 2212.80
6.19
15671500
(17.22)
6.42
1.91
95.02
94.74
TECHM 775.75
1.00
15406800
8.21
9.05
0.65
96.29
97.15
WIPRO 249.90
3.65
18211200
(29.64)
-2.08
0.72
83.12
92.60
MISCELLANIOUS
ADANIENT
849.55
65.31
17882000
(1.92)
9.35
0.50
94.47
96.98
APOLLOHOSP
3097.50
17.97
1330000
(0.08)
2.59
0.22
92.49
90.69
BATAINDIA
1488.70
(2.77)
1615350
75.97
5.36
0.86
94.23
93.66
BEL 142.15
8.97
29199200
5.00 4.14
0.34
93.89
93.27
CONCOR
579.25
32.48
6001920
(9.00)
9.18
0.30
89.91
92.67
CUMMINSIND
809.25
28.17
1450800
(27.39)
6.72
0.16
91.18
92.48
INDIGO
1666.70
4.75
3140000
20.79
5.10
0.53
96.36
93.67
OIL & GAS
BPCL
463.15
20.27
21110400
(17.95)
4.52
0.59
86.59
88.35
GAIL
151.50
17.44
29957100
36.53
6.05
0.40
87.43
87.36
HINDPETRO
252.95
14.28
35953200
41.92
2.58
0.49
89.63
92.40
IGL
515.25
(3.62)
6796625
33.92
9.43
0.58
87.41
91.98
IOC
101.65
9.71
71571500
32.23
9.69
0.48
93.14
90.60
MGL
1201.70
14.53
1564200
(3.30)
4.35
0.53
95.74
88.94
ONGC
118.45
31.83
44136400
(0.12)
-6.57
0.51
85.01
83.87
PETRONET
259.90
7.00
17169000
23.23
6.05
0.37
93.24
96.39
RELIANCE
2157.70
14.61
26761250
(10.49)
8.09
0.49
95.70
95.34
PHARMACEUTICAL
AUROPHARMA
867.05
(8.56)
9348950
24.91
5.74
0.76
94.36
93.46
BIOCON
400.40
5.00
14697000
(22.42)
8.52
0.66
95.92
95.47
CADILAHC
439.75
(5.09)
10588600
6.77
5.06
0.56
95.34
96.12
CIPLA
811.45
(3.78)
11404900
(31.99)
3.71
0.61
95.84
96.36
DIVISLAB
3464.55
0.75
3045000
(6.11)
9.30
0.76
95.14
94.41
DRREDDY
4513.00
(7.57)
3230500
15.61
9.57
0.68
96.40
96.78
GLENMARK 476.05
(1.28)
5862700
35.62 9.10
0.63
96.10
94.98
LUPIN
1028.10
(2.51)
7849750
(7.97)
4.58
0.57
95.21
96.20
PEL
1959.70
41.91
3570600
(12.27)
6.69
0.36
90.23
94.96
SUNPHARMA
612.90
8.42
40994800
(3.20)
7.16
0.52
97.65
95.70
TORNTPHARM
2480.80
(6.60)
1041250
43.23
7.05
0.53
97.00
97.10
Derivatives Rollover Report
For Private Circulation Only
6
Scrip Price
Price
Change
(%) OI Futures
OI
Change
(%) COC (%) PCR-OI
Rollover
(%)
Average
Rollover
(3month)
(%)
POWER
NTPC
108.75
20.63
82370700
23.84
9.05
0.41
89.85
84.66
POWERGRID
224.35
19.40
11084000
(10.70)
-18.33
0.55
74.17
77.09
TATAPOWER
96.60
24.56
135621000
34.63
8.15
0.48
94.87
94.28
TORNTPOWER
392.55
28.01
3189000
(32.34)
-2.32
0.18
93.08
94.79
REAL ESTATE
DLF
315.90
20.37
24548700
1.63
4.97
0.50
95.10
89.63
TELECOM
BHARTIARTL
580.70
1.33
83124708
(9.95)
3.49
0.68
91.95
94.95
IDEA
11.75
(0.84)
848050000
8.86
11.19
0.51
92.83
92.87
TEXTILES
PAGEIND
28895.90
(0.26)
81480
55.64
4.78
0.63
96.04
91.46
SRF
5575.20
3.77
279750
(21.50)
8.20
0.33
96.88
95.12
POWER

Derivatives Rollover Report
For Private Circulation Only
7
Technical and Derivatives Team:
Sameet Chavan Chief Analyst - Technical & Derivatives sameet.chavan@angelbroking.com
Ruchit Jain Senior Analyst - Technical & Derivatives ruchit.jain@angelbroking.com
Rajesh Bhosale Technical Analyst rajesh.bhosle@angelbroking.com
Sneha Seth Derivatives Analyst sneha.seth@angelbroking.com
Research Team Tel: 022 - 39357600 (EXTN - 6844) Website: www.angelbroking.com
For Technical & Derivative Queries E-mail: technicalresearch-cso@angelbroking.com
DISCLAIMER
Angel Broking Limited (hereinafter referred to as “Angel”) is a registered Member of National Stock Exchange of India Limited,
Bombay Stock Exchange Limited and Metropolitan Stock Exchange Limited. It is also registered as a Depository Participant with
CDSL and Portfolio Manager and Investment Adviser with SEBI. It also has registration with AMFI as a Mutual Fund Distributor.
Angel Broking Limited is a registered entity with SEBI for Research Analyst in terms of SEBI (Research Analyst) Regulations, 2014
vide registration number INH000000164. Angel or its associates has not been debarred/ suspended by SEBI or any other regulatory
authority for accessing /dealing in securities Market. Angel or its associates/analyst has not received any compensation / managed
or co-managed public offering of securities of the company covered by Analyst during the past twelve months.
This document is solely for the personal information of the recipient, and must not be singularly used as the basis of any
investment decision. Nothing in this document should be construed as investment or financial advice. Each recipient of this
document should make such investigations as they deem necessary to arrive at an independent evaluation of an investment in the
securities of the companies referred to in this document (including the merits and risks involved), and should consult their own
advisors to determine the merits and risks of such an investment.
Reports based on technical and derivative analysis center on studying charts of a stock's price movement, outstanding positions
and trading volume, as opposed to focusing on a company's fundamentals and, as such, may not match with a report on a
company's fundamentals. Investors are advised to refer the Fundamental and Technical Research Reports available on our website
to evaluate the contrary view, if any.
The information in this document has been printed on the basis of publicly available information, internal data and other reliable
sources believed to be true, but we do not represent that it is accurate or complete and it should not be relied on as such, as this
document is for general guidance only. Angel Broking Limited or any of its affiliates/ group companies shall not be in any way
responsible for any loss or damage that may arise to any person from any inadvertent error in the information contained in this
report. Angel Broking Limited has not independently verified all the information contained within this document. Accordingly, we
cannot testify, nor make any representation or warranty, express or implied, to the accuracy, contents or data contained within this
document. While Angel Broking Limited endeavors to update on a reasonable basis the information discussed in this material,
there may be regulatory, compliance, or other reasons that prevent us from doing so.
This document is being supplied to you solely for your information, and its contents, information or data may not be reproduced,
redistributed or passed on, directly or indirectly.
Neither Angel Broking Limited, nor its directors, employees or affiliates shall be liable for any loss or damage that may arise from or
in connection with the use of this information.
